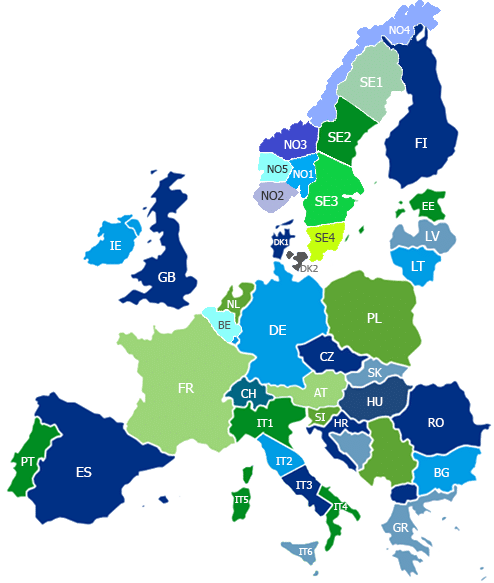
Overview — electricity prices in Europe (2 Aug 2026), in €/kWh:
- Typical cluster: most markets around 0.10–0.12 €/kWh (Belgium 0.10, Bulgaria 0.10, Czech Rep. 0.11, France 0.10, Germany 0.11, Netherlands 0.10, Poland 0.11, Portugal 0.10, Spain 0.11, Austria 0.12, Romania 0.12, Hungary 0.12).
- Low-price group: Baltic and Nordic lows — Estonia 0.02, Finland 0.02, Sweden SE1–SE4 0.02; Latvia 0.03, Lithuania 0.03.
- Norway: regional spread with an average of 0.07; ranges from NO4 at 0.01 (lowest) up to NO2 at 0.10.
- Italy: overall average 0.17 with most regions at 0.16 (North, Centre‑North, Centre‑South, South, Sardinia) and Sicily highest at 0.19.
- Other higher prices: Ireland 0.17.
- Overall range today: 0.01 €/kWh (Norway NO4) to 0.19 €/kWh (Italy, Sicily).
Electricity prices in Europe
| Today Average Price €/kWh | |
|---|---|
 Austria Austria
|
0.1162 |
 Belgium Belgium
|
0.1040 |
 Bulgaria Bulgaria
|
0.1009 |
 Czech Republic Czech Republic
|
0.1070 |
 Denmark Denmark
|
0.1060 |
 Estonia Estonia
|
0.0245 |
 Finland Finland
|
0.0185 |
 France France
|
0.0992 |
 Germany Germany
|
0.1055 |
 Greece Greece
|
0.0969 |
 Hungary Hungary
|
0.1222 |
 Ireland Ireland
|
0.1650 |
 Italy Italy
|
0.1673 |
 Latvia Latvia
|
0.0296 |
 Lithuania Lithuania
|
0.0296 |
 Netherlands Netherlands
|
0.1045 |
 Norway Norway
|
0.0696 |
 Poland Poland
|
0.1070 |
 Portugal Portugal
|
0.1064 |
 Romania Romania
|
0.1195 |
 Spain Spain
|
0.1110 |
 Sweden Sweden
|
0.0180 |
The Evolving European Energy Market: Trends and Challenges
Over the past five years, Europe’s energy market has undergone significant transformations, driven by the rise of renewable energy, shifts in electricity generation, and the adoption of dynamic tariffs for consumers. These trends are shaping the continent’s transition toward a cleaner and more resilient energy system.
Primary Electricity Sources in Europe
Europe’s electricity mix has shifted dramatically, with renewable energy surpassing fossil fuels as the dominant source of power. In 2023, renewables accounted for approximately 45% of the EU’s electricity generation, outpacing fossil fuels (~32%) and nuclear (~23%). Wind and solar have been the primary drivers of this transition, contributing to around 30% of total electricity production. Meanwhile, coal-fired generation has plummeted to record lows, and natural gas usage has also declined due to high prices and policy-driven reductions.
Despite these advances, Europe remains dependent on energy imports, particularly for oil and gas. In 2023, the EU’s energy import dependency stood at 58%, highlighting the need for greater domestic energy production and efficiency improvements.
The Growing Role of Renewables
The expansion of renewable energy has been central to Europe’s energy transformation. Wind and solar power have seen rapid growth, with wind supplying 18.5% of the EU’s electricity and solar providing 9.1% in 2023. Hydropower remains a key contributor (~13.5%), while biomass accounts for approximately 4-5% of generation.
EU policies, including the European Green Deal and the "Fit for 55" package, have accelerated the transition by setting higher renewable energy targets. In 2023, the EU raised its 2030 renewable energy consumption goal from 32% to 42.5%, encouraging further investments in clean power. Technological advancements and cost reductions in wind and solar energy have also made renewables the most economically viable option for new electricity generation.
However, integrating high levels of renewables presents challenges, particularly due to their intermittent nature. Grid upgrades, energy storage solutions, and cross-border electricity trading are essential to ensuring a stable and flexible power system. Additionally, slow permitting processes have hindered the rapid deployment of new renewable projects, prompting EU initiatives to streamline approvals.
The Rise of Dynamic Tariffs
Dynamic electricity pricing is gaining traction across Europe, allowing consumers to adjust their energy usage based on real-time market conditions. With the widespread deployment of smart meters, many households and businesses can now access time-of-use or real-time pricing models, reducing costs and easing grid congestion.
Nordic countries have led the way in adopting dynamic tariffs, with Sweden seeing 77% of households on variable pricing contracts. Spain has implemented a national hourly pricing system (PVPC), while Germany and Italy are gradually increasing their adoption. However, many EU countries still rely primarily on fixed-price contracts, limiting the full potential of demand flexibility.
The 2021–2022 energy crisis highlighted both the risks and benefits of dynamic tariffs. While customers on real-time pricing saw higher bills during peak price periods, those able to adjust their consumption managed to cut costs significantly. Moving forward, hybrid models—combining dynamic pricing with protective mechanisms like price caps—are being explored to balance flexibility with affordability.
Conclusion
Europe’s energy market is in the midst of a major transformation. The rapid expansion of renewables, declining fossil fuel dependency, and the rise of dynamic tariffs are reshaping how electricity is generated and consumed. While challenges remain—such as grid integration, storage, and price volatility—continued investment in clean energy and innovative market mechanisms will drive Europe toward a more sustainable and resilient energy future.